SKU:
PR622222
New Playful Data
$89.99
Unit price
/
Unavailable
Author: Wang Shaoqiang Publisher: Promo Press / Hoaki
Bind: paperback
Dimensions: 210 x 285 mm
Pages: 240
Publication Date: 01-07-2021
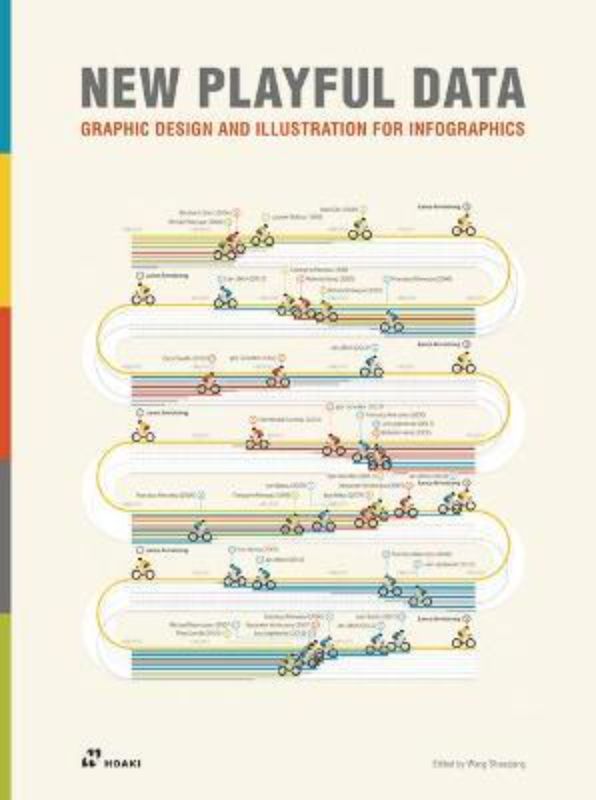
New Playful Data: Graphic Design and Illustration for Infographics features brilliant and illustrative infographic projects from gifted graphic designers, illustrators, artists, and even scientists. Not only do they visualize data in a tangible and memorable way through playful illustrations, but they also provide us with inspiration for balancing colors, words, and images, as well as for distinguishing between primary and secondary information when data is presented alongside pictures. The projects revealed in this volume are divided into three main categories: statistical findings, flow diagrams, and instruction and explanation. Some of the projects illustrate data acquired from rigorous and precise scientific research, while others are the product of designers' imagination and experimentation. It's time to learn to play with data!
Delivery Information
Delivery Information
All of our products are stocked in New Zealand, and shipped from our Auckland warehouse, this means no unexpected import fees or taxes.
Payment & Security
Payment methods
Your payment information is processed securely. We do not store credit card details nor have access to your credit card information.


